
Case Study · Cloud Cost Hygiene
A read-only GCP cost audit that ended in billing-measured savings.
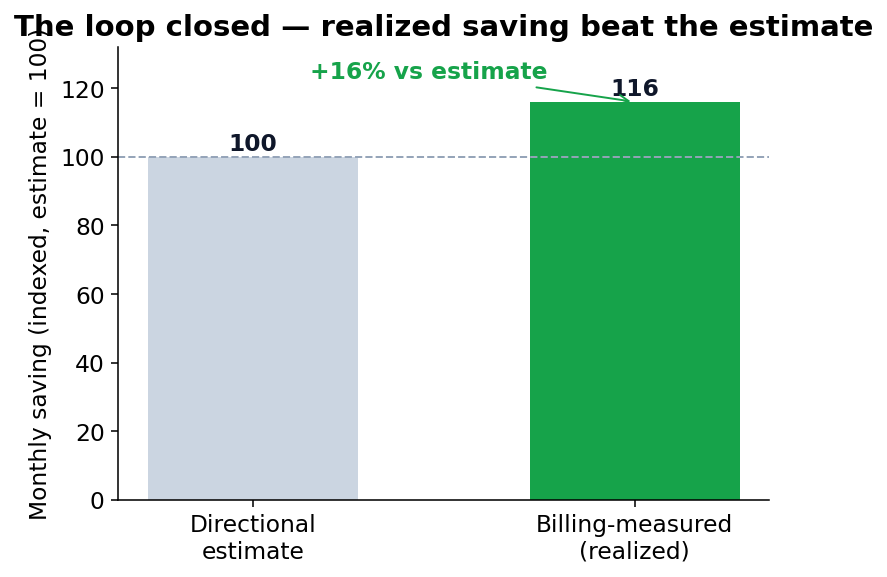
A product company running on Google Cloud needed a clear, owner-by-owner view of rising spend — and recommendations safe enough to act on. We delivered a reconciled, risk-reviewed audit. Every recommendation was accepted into the engineering backlog, and the first shipped change was measured against the billing export — it beat its estimate.
De-identified. The client is anonymized and absolute spend is withheld; figures are shown as percentages or indexed values. The findings and outcomes are real and were validated read-only against the client's own billing export.
The situation
Cloud spend was rising, with only ~3 months of usable billing history (GCP's export has no backfill), no dedicated FinOps function, and no board-credible way to answer where the money goes, whose it is, and what is safe to act on. GCP's native labels carried only machine metadata — business ownership wasn't derivable from the console.
What we did — and why the numbers can be trusted
- Reconciled first. The normalized cost model ties out to the official export at 0.00% on complete months. Nothing downstream is reported until it reconciles.
- Allocated by business dimensions. Project → environment → owner, via an ownership map confirmed with the client; ~97% of spend resolved to a named owner.
- Separated real cost from FX. GCP prices in USD; the client settles in JPY — the two trends are decomposed so currency movement can't hide the real one.
- Netted commitments. Savings were reported net of committed-use coverage — no phantom savings that a commitment would strand.
- Read-only, least-privilege. No billing-admin, no IAM-admin, no resource changes. Privileged setup stayed client-side via a guided runbook.
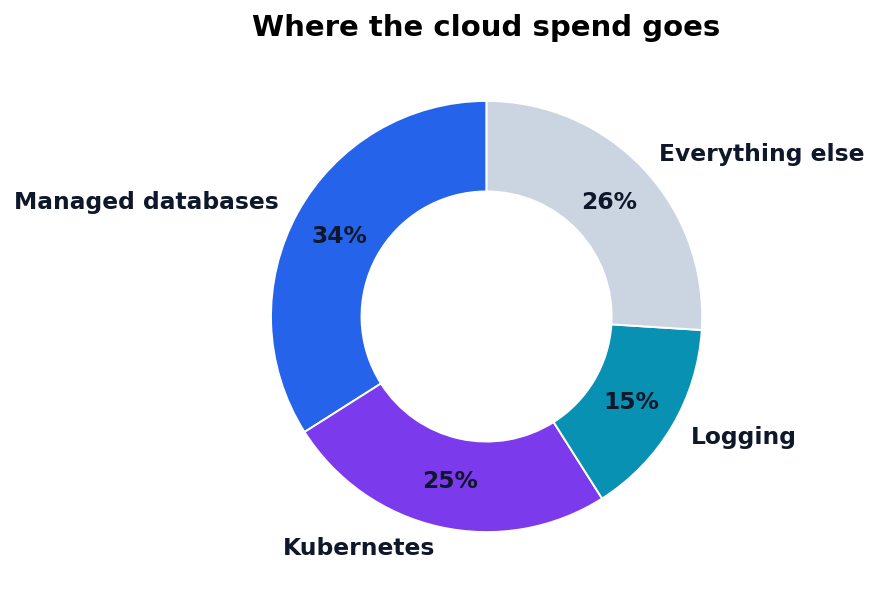
Where the money goes
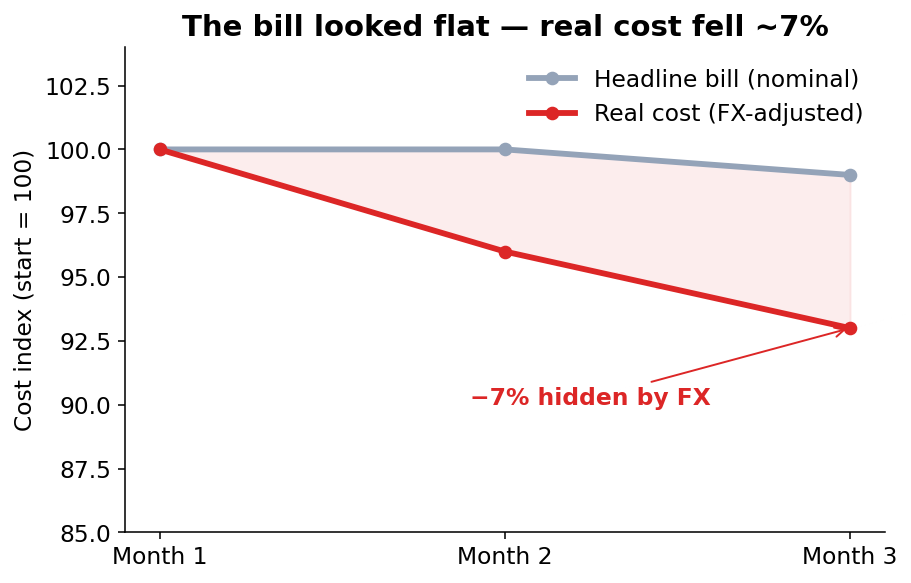
Finding 1 — the bill looked flat; real cost was falling
The headline bill barely moved. FX decomposition showed a weakening settlement currency was masking a genuine ~7% real decline. Without separating the two, a flat bill reads as "nothing changed" — and an earlier optimization that was actually working goes unnoticed.
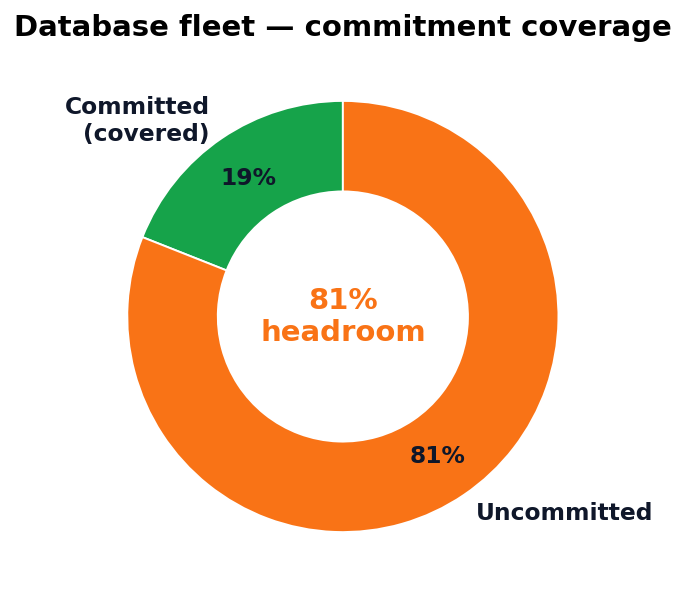
Finding 2 — the biggest driver was mostly uncommitted
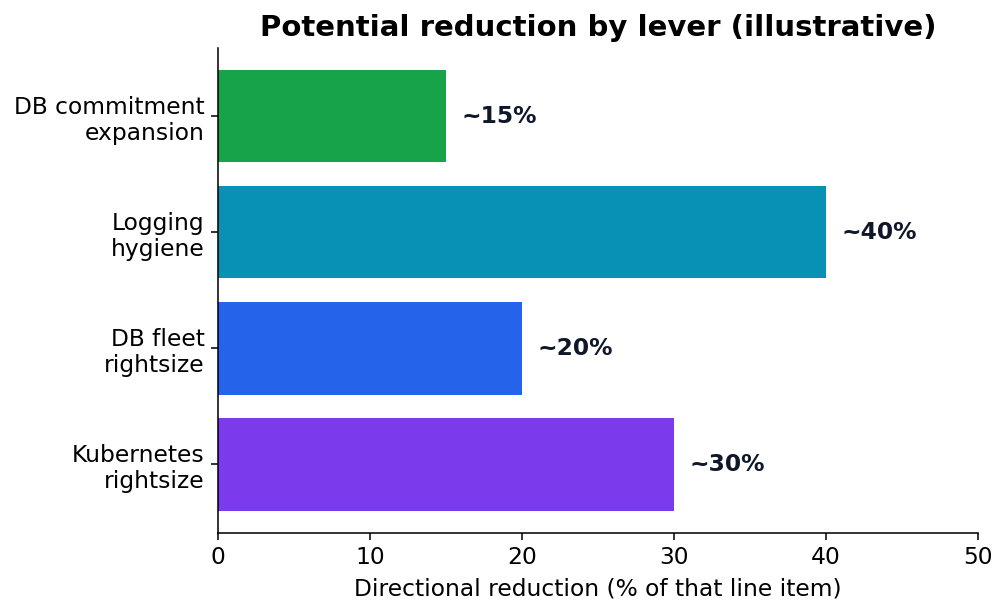
The database fleet was the top cost, but only ~19% of its steady-state spend was covered by committed-use discounts — ~81% ran on-demand. That gap was the single largest directional saving. We did not turn it into a naive "buy a 3-year commitment" line: the recommendation carried the multi-year-lock risk, a "3-month baseline is too short for a multi-year decision" caveat, and the observation that existing commitments were already ~100% utilized (healthy — nothing to claw back).
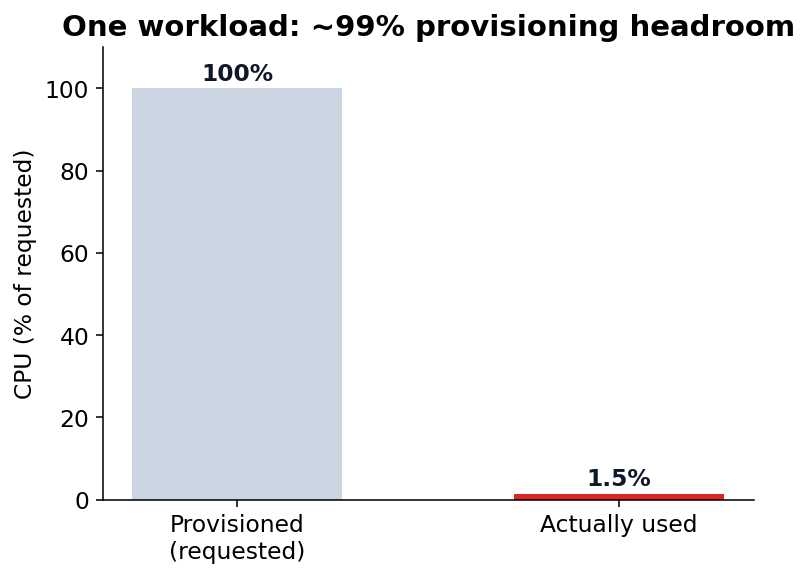
Finding 3 — rightsizing with judgment, not a blunt cut
- Database replicas were provisioned at 8 vCPU but peaked around ~2.5% CPU — the fix cuts vCPU while keeping memory (the real constraint). A CPU-only view would have mis-sized it and risked an incident.
- One gateway workload ran 17 replicas at ~1% request utilization — genuine over-provisioning. But pod-level analysis showed other "idle-looking" workloads were healthy; their low averages were an artifact of pod churn. We rightsized only the clear case and referred the load-distribution question to an architecture review instead of cutting blind.
- A small BI database at ~100% memory got the cheapest effective path first (scheduling, consolidation) — not a reflexive, billable upsize.
Finding 4 — a quiet, compounding logging cost (and the wrong obvious fix)
A single SKU was ~99.99% of logging cost, ~91% concentrated in production, creeping up ~7% month over month. The catch: Cloud Logging is priced on ingestion, not retention — the SKU name ("Log Storage cost") points intuition the wrong way. Shortening retention would have done nothing. The effective lever was to stop ingesting the noise (exclusion filters on the default sink), route might-need-later logs to cold storage, and keep ERROR/WARNING intact.
Directional potential by lever
The outcome — a loop that closed
All eight substantive recommendations were acknowledged by the system owners and accepted into the engineering backlog. Trivial-but-risky items (a few idle reserved IPs worth a few dollars a month) were deliberately held — releasing them costs more in churn and risk than the saving.
It didn't stop at "recommended". The logging recommendation shipped, and was then measured against the billing export: log ingestion fell ~57% (production) and ~62% (staging), with the realized monthly saving coming in above the directional estimate. Candidate → owner-validated → shipped → billing-confirmed.
Why this beats a console screenshot
- Business allocation & ownership — the console doesn't know your org chart.
- Risk-reviewed proposals — multi-year-lock framing, downtime flags, net-of-commitment savings, and the judgment to not push a trivial-but-risky "saving".
- A reconciled, auditable artifact — a packaged report that ties to the official export, not a screenshot.
- Doing, not just knowing — a monthly cadence a small team won't run themselves.
Start with a scoped, read-only Cloud Cost Hygiene review — reconciled to your billing export, allocated to your owners, and risk-reviewed before anything is proposed.